Tarsier LabsTarsier Labs
🐵
Home
Categories
Tags
Bookmarks
About
Back to tags

Monitoring

0 articles

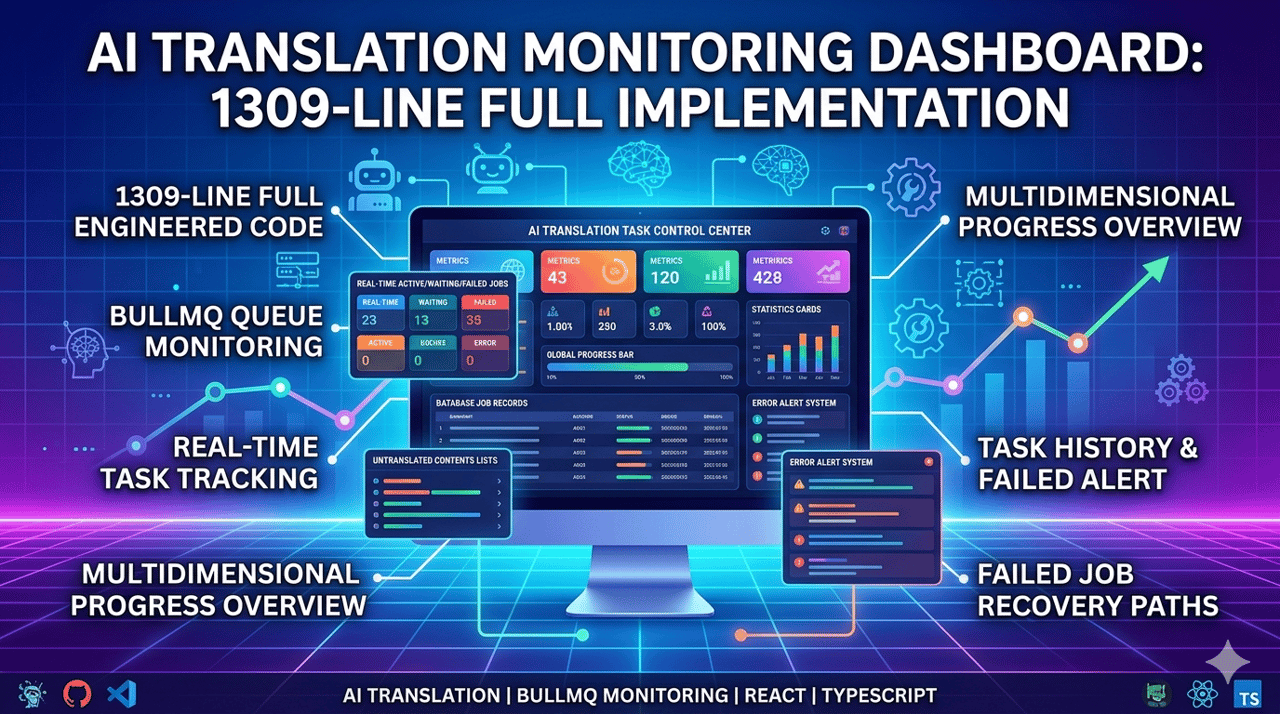
AI Translation Task Monitoring Dashboard: 1309 Lines Complete Engineering Implementation

AI Translation Task Monitoring Dashboard: 1309 Lines Complete Engineering Implementation

Build an enterprise-level AI translation monitoring center—from BullMQ queue real-time monitoring, multi-dimensional progress tracking, to task history management and error alerts

00
Frontend Development
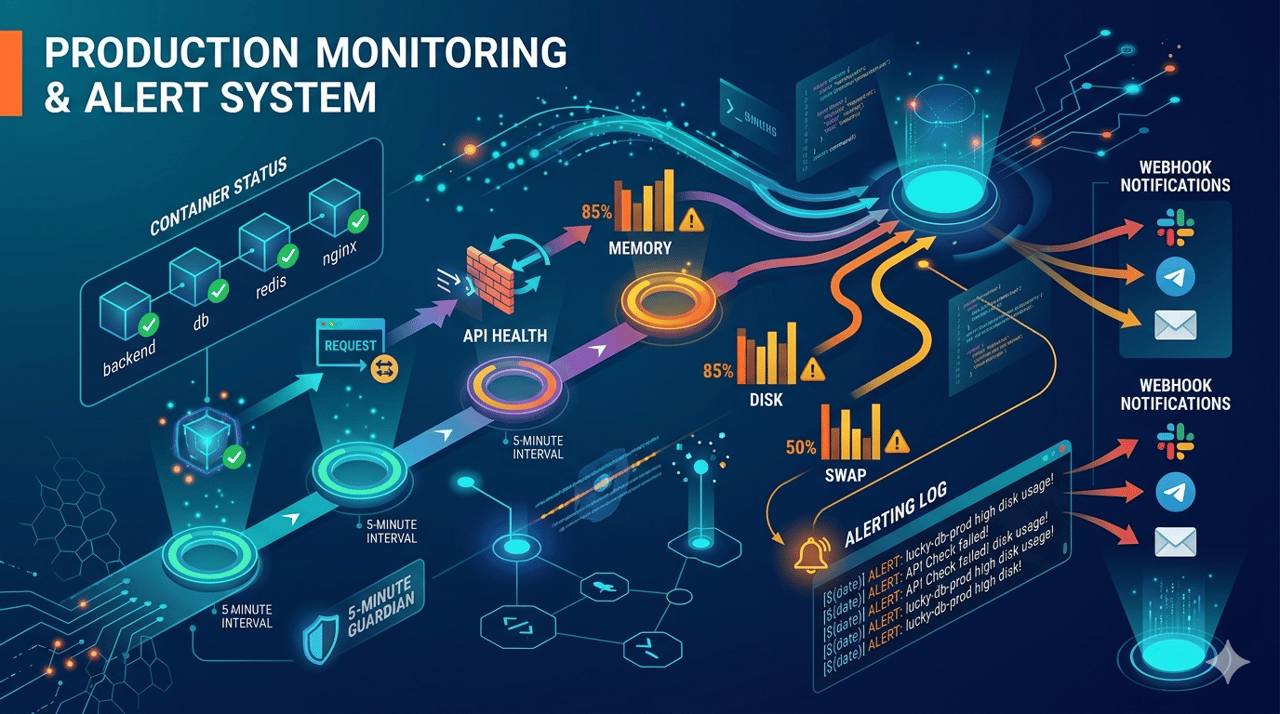
Lightweight Production Monitoring & Alerting System — A 5-Minute Guardian in 85 Lines of Shell Script

Lightweight Production Monitoring & Alerting System — A 5-Minute Guardian in 85 Lines of Shell Script

Based on a production-grade monitor.sh script, this article details the design philosophy behind container status checks, API health probes, and memory/disk/Swap threshold alerts. It covers cron automation, the fault-tolerance philosophy of set +e, and webhook extension plans.

00
Operations and Deployment
Practical Guide to Building a Full-Link Monitoring System with Sentry + Lighthouse CI

Practical Guide to Building a Full-Link Monitoring System with Sentry + Lighthouse CI

00
Operations and Deployment
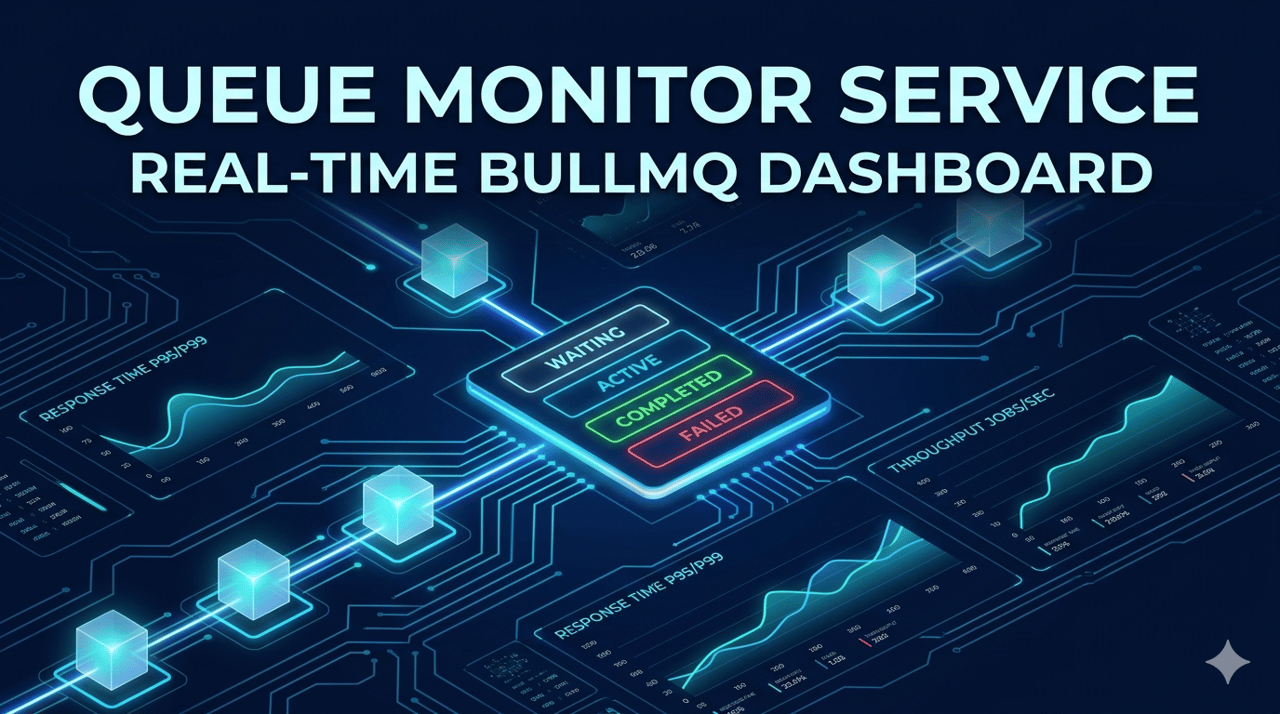
QueueMonitorService: BullMQ Queue Monitoring Dashboard

QueueMonitorService: BullMQ Queue Monitoring Dashboard

The JoyMini API queue monitoring service builds a real-time dashboard based on the BullMQ event system, tracking queue status, Job progress, failure rates, and processing latency, supporting visual operations in the admin backend.

00
Interface Management
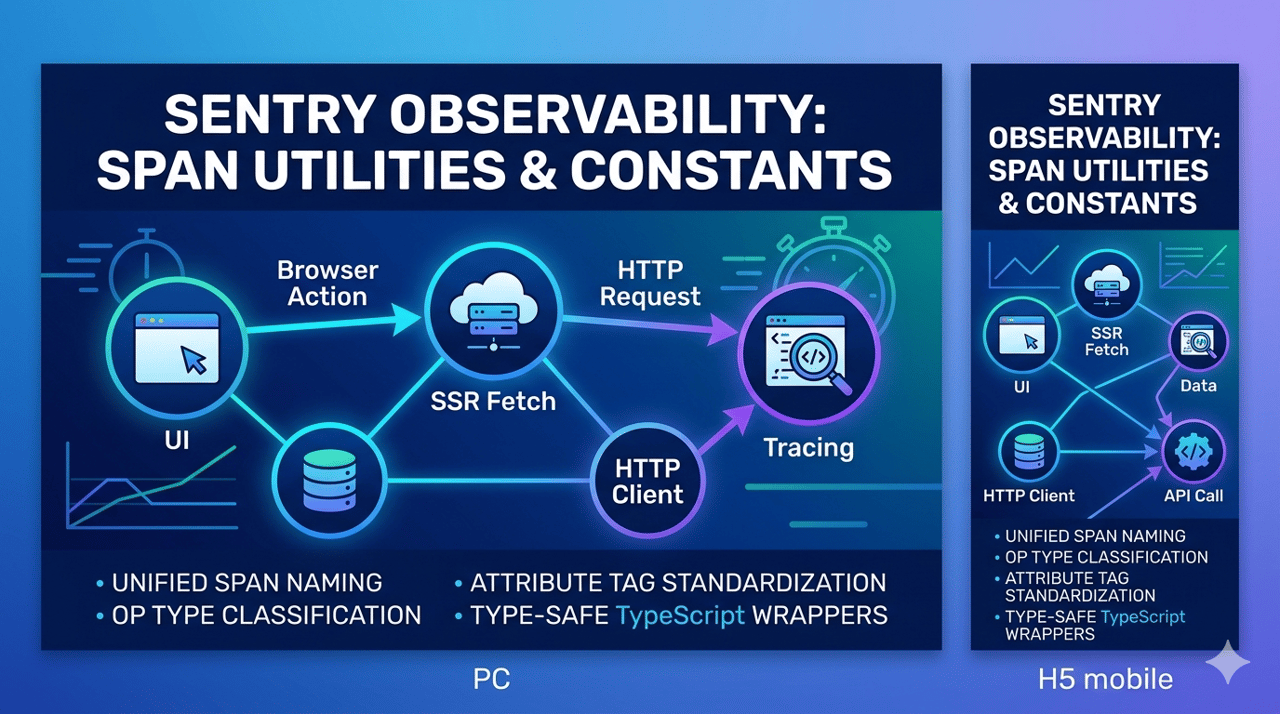
Sentry Observability — Span Constants and Utility Functions

Sentry Observability — Span Constants and Utility Functions

The Sentry observability system in the admin backend achieves unified naming conventions, operation type classification, and attribute label standardization for full-link tracing through custom Span constants and utility functions.

00
Management Backend